Narrate a chart without overstating the numbers
Explain a chart aloud with its units, period and denominator intact. Use a worked example to separate rising counts from an unchanged share.
 EasyLines team7 min read
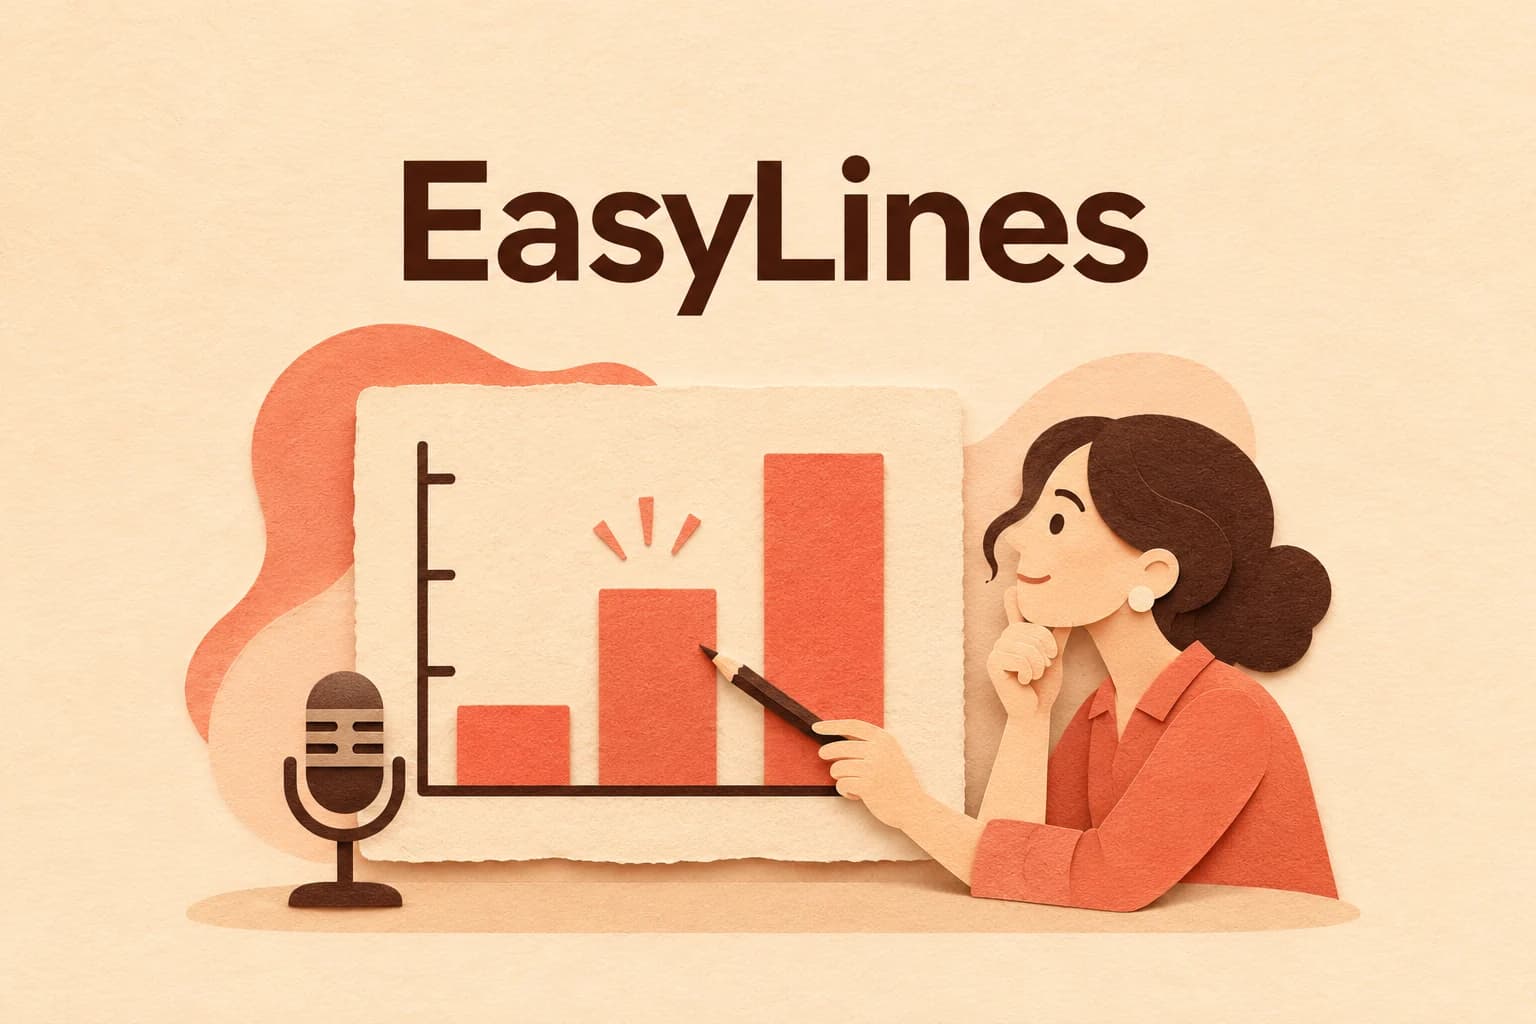
AI-generated editorial illustration.
On this page 8 sections
- 1. Choose the question the chart will answer
- 2. Give listeners the frame before the conclusion
- 3. Work through counts and shares separately
- 4. Check which stronger statements the chart cannot support
- 5. Make the information understandable without pointing
- 6. Read the exact values with the actual picture
- 7. Audit the final takeaway and leave its limits attached
- 8. Frequently asked questions
Narrate a chart by identifying what it measures, explaining the comparison the viewer needs, and stating only the conclusion those values support. Say the units, period and relevant denominator before relying on words such as more, higher or improved. A chart can show a larger count while the share remains unchanged. The hypothetical example below turns that distinction into a complete spoken explanation, without inventing a reason for the difference.
Choose the question the chart will answer
Write the viewer’s question above your narration. “What does this chart show?” is a starting point, but “Did the share of blue-tabbed practice cards change between the two sessions?” gives you a specific comparison. It tells you to inspect the total number of cards as well as the blue-tab count. Without that question, a taller bar can tempt you into narrating whichever change looks most dramatic.
Check the source material behind the chart before writing its conclusion. Find the definitions, dates and any note about missing observations. If you cannot establish what a label counts, leave that interpretation unresolved. The chart’s appearance cannot supply a definition that the source lacks. Keep the source version with your draft so a later change to the figure does not leave an earlier narration attached to it.
Give listeners the frame before the conclusion
Introduce the subject, categories or time range, and unit in plain language. A line might begin, “This chart compares the number of practice cards with blue tabs in the April and May sessions.” If the vertical axis is a count, say cards. If it is a percentage, say a percentage of which total. Do not make viewers discover the unit from tiny axis text while you have already moved into an interpretation.
Storytelling with Data’s explanation guide recommends introducing the graph and axes, then relevant definitions and date or method context before discussing the main information. Use the pieces needed for this chart. That recommendation does not require reciting every tick mark. A complicated legend or changed definition deserves spoken explanation when it affects the comparison you are asking the viewer to make.
Work through counts and shares separately
Consider invented workshop records used only for this writing exercise. April has twenty practice cards, ten with blue tabs. May has thirty practice cards, fifteen with blue tabs. These are hypothetical counts, not findings from an actual workshop. Imagine the displayed bars represent the blue-tab counts: ten and fifteen. The totals are provided beside them. Both pieces of information matter to the question about share.
Ten divided by twenty is one half, or fifty percent. Fifteen divided by thirty is also fifty percent. The blue-tab count increases by five cards, while the share is unchanged. Saying “the share increased” would be wrong for these invented values. Saying “there were more blue-tabbed cards in May” is accurate but incomplete if the viewer’s question concerns proportion. State the count comparison and the denominator relationship together.
Hypothetical narration: “This chart shows blue-tabbed practice-card counts for April and May. April has ten out of twenty cards; May has fifteen out of thirty. The count is five cards higher in May, but blue-tabbed cards make up half of each session’s total. This comparison shows an unchanged share across these two sessions. It does not tell us why the totals differ.”
Check which stronger statements the chart cannot support
Two session values establish a comparison between those sessions. They do not by themselves show what happened in every week between them or what will happen next. Avoid describing a steady trend when the figure gives only isolated snapshots. If the source includes more periods, inspect those periods before selecting language about a sustained rise or decline. Your spoken claim should match the observations actually available.
Keep explanation and cause separate. The fictional tab counts do not tell you whether a new sorting method, different attendance or a recording mistake changed the total. “The new method caused more blue tabs” introduces information absent from the example. If a real source proposes a reason, identify it as that source’s explanation and inspect the support separately. Do not turn the order of events into a causal claim just to give the chart a satisfying ending.
Make the information understandable without pointing
Replace “this one” and “the bigger bar” with the category or period when those words carry the comparison. Pointing can help a viewer locate a value, but the spoken line should still identify what you mean. If color differentiates categories, name their labels too. “The blue line” alone loses its reference when someone cannot distinguish the color or is listening without the picture.
W3C WAI’s presentation guidance recommends describing relevant visual information aloud and covering its information without necessarily reading the slide verbatim. Apply that to the chart’s meaningful comparison. This narration pass is one part of preparing usable media, not a claim that audio alone meets every accessibility need. Preserve a suitable written data reference alongside the video where your publishing workflow allows it.
Read the exact values with the actual picture
Keep the chart visible as you rehearse and check each spoken category, value and unit against it. If the picture says percentage while you say cards, stop and resolve the mismatch. If the bars are sorted differently in the final export, update your pointing and narration. A script can remain numerically correct while referring to the wrong visible position after a design change.
Use the names and numbers rehearsal workflow when saying the verified values is difficult. Keep that delivery task separate from the arithmetic and interpretation. For the fictional example, a working note can retain both fractions and both percentages even if the final spoken line uses “half.” That note lets a reviewer inspect the reasoning without asking the audience to hear every calculation.
Audit the final takeaway and leave its limits attached
Listen to the complete recorded passage, including the sentence immediately after the chart. A careful comparison can be undermined by a casual “so the method worked” at the transition. Use the sentence-level claim check to compare that takeaway with the same evidence. Retain important qualifications in the audible explanation, rather than leaving them only in production notes nobody watching will receive.
Save the figure version, source, checked date, narration and any calculation together. Identify which values would require a new recording if they change. EasyLines is preparing to launch as a teleprompter and recorder; join the waitlist for updates if prepared narration suits your workflow. Your chart interpretation and calculations remain editorial work to finish before the final read.
Frequently asked questions
Should I read every number on a chart?
Include the values and context needed for the promised comparison. Keep the complete data available in a suitable reference when detail exceeds what the spoken explanation can carry.
Can a rising count have an unchanged percentage?
Yes. In the hypothetical example, ten of twenty and fifteen of thirty both equal fifty percent. State the denominator when it matters.
Can two points establish a steady trend?
They establish a comparison between those observations. Check additional periods before describing a sustained pattern.
What if the chart does not explain why a value changed?
Say what changed and leave the reason unresolved. Do not invent a causal explanation from the shape alone.
Is pointing at the chart enough?
Name the category, period and unit in the spoken line when those identify the comparison. Pointing can supplement that explanation.
Sources and further checks
Coming to iPhone and iPad
Put your next script on EasyLines.
A little help with the words. More room to be yourself. Join the waitlist and we’ll email you at launch.